How to Forecast Inventory Demand
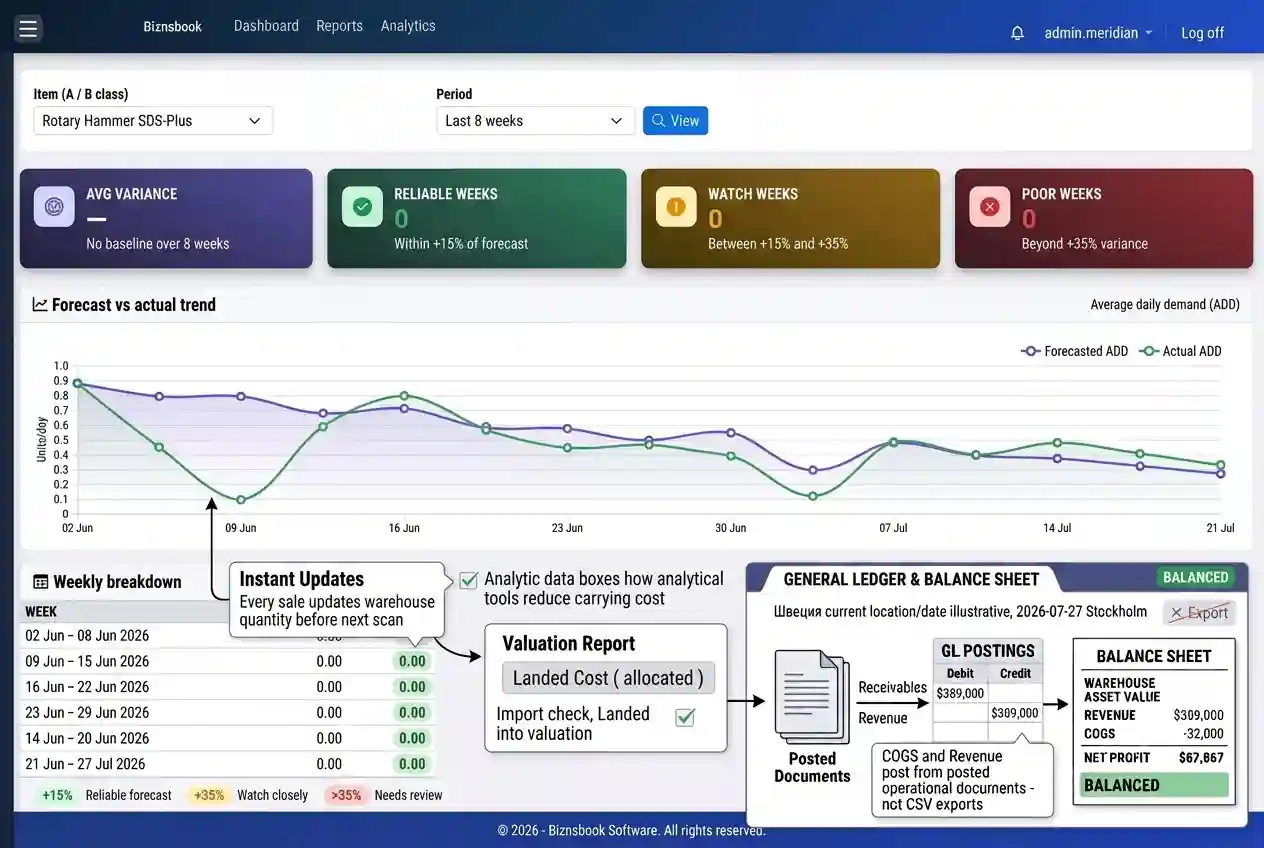
Buying on last month alone fails in volatile markets
Reactive buying amplifies bullwhip effect: a small demand spike becomes a massive PO, then overstock when reality normalizes.
Promotions, weather, and supplier delays are ignored by simple moving averages in spreadsheets.
Without measuring forecast error, buyers repeat the same mistakes every season.
Why this happens
- No baseline usage calculated from stock card.
- Promotions not flagged in forecast window.
- All SKUs forecasted equally.
- Forecast never compared to actuals.
These patterns show up across SMB inventory teams regardless of industry. The fix is usually process plus tooling — not hiring one more buyer. Biznsbook addresses this topic through demand forecast, weeks on hand, ABC classification when the Inventory module (and related Warehouse, Purchase, or Integration modules where noted) is enabled for your tenant.
Leaders often underestimate how much informal workarounds cost: extra emails, duplicate counts, and end-of-month fire drills. Documenting who owns each step — and which screen in Biznsbook is the system of record — removes ambiguity that spreadsheets never solve.
Step-by-step: Forecast Inventory Demand
The following workflow is designed for owners, warehouse leads, and finance reviewers who need a repeatable process. Adapt roles to your team size — separation of duties matters more than headcount.
- Establish baseline usage by SKU. Derive average daily or weekly usage from posted sales and issues on stock card.
- Run demand forecast view. Review weeks-on-hand projections and reorder suggestions in Biznsbook.
- Prioritize with ABC classification. Invest forecast tuning time on A items; use simple rules for C items.
- Adjust for known events. Overlay promotions, seasonality, and new customer wins on top of system suggestions.
- Track forecast accuracy by period. Use forecast accuracy view to compare forecast vs actual trends.
- Feed accuracy back to replenishment settings. Increase safety stock where error is high; decrease where stable.
- Collaborate with sales on pipeline. Large B2B deals may need manual forecast bump before system history exists.
After implementing these steps, review results in the first full cycle (usually one month). Adjust thresholds, permissions, or training where the same exception repeats. Inventory improvement compounds when feedback loops are short.
For related screen-level flows, see the Biznsbook Help Center (for example GRN, transfers, batch tracking, or Shopify setup). This guide stays focused on the business problem; help articles cover click-by-click navigation.
Common mistakes to avoid
- Mistake 1: Ignoring that no baseline usage calculated from stock card. Teams that skip corrective process here usually see the same emergency twice in one quarter.
- Mistake 2: Ignoring that promotions not flagged in forecast window. Teams that skip corrective process here usually see the same emergency twice in one quarter.
- Mistake 3: Ignoring that all SKUs forecasted equally. Teams that skip corrective process here usually see the same emergency twice in one quarter.
- Mistake 4: Ignoring that forecast never compared to actuals. Teams that skip corrective process here usually see the same emergency twice in one quarter.
Most failures are repeat offenses, not one-off disasters. Track exceptions in your ops meeting notes and tie each back to a control in the step-by-step section.
Best practices that hold up as you scale
- Establish baseline usage by SKU — Derive average daily or weekly usage from posted sales and issues on stock card.
- Run demand forecast view — Review weeks-on-hand projections and reorder suggestions in Biznsbook.
- Prioritize with ABC classification — Invest forecast tuning time on A items; use simple rules for C items.
- Adjust for known events — Overlay promotions, seasonality, and new customer wins on top of system suggestions.
- Track forecast accuracy by period — Use forecast accuracy view to compare forecast vs actual trends.
Consistency beats intensity. A medium-sized distributor that posts every GRN the same day will outperform a larger competitor that counts annually but posts sporadically.
How Biznsbook supports this workflow
demand forecast in Biznsbook is part of the verified Inventory module capability set (see product documentation). Use it in the workflow above rather than as a standalone report: connect demand forecast to daily receiving, shipping, and count routines so data stays current. When Warehouse, Purchase, Sales, POS, or Integration modules are licensed, the same stock ledger feeds demand forecast without duplicate entry — that integration is where SMB teams recover the hours lost to spreadsheet reconciliation.
weeks on hand in Biznsbook is part of the verified Inventory module capability set (see product documentation). Use it in the workflow above rather than as a standalone report: connect weeks on hand to daily receiving, shipping, and count routines so data stays current. When Warehouse, Purchase, Sales, POS, or Integration modules are licensed, the same stock ledger feeds weeks on hand without duplicate entry — that integration is where SMB teams recover the hours lost to spreadsheet reconciliation.
ABC classification in Biznsbook is part of the verified Inventory module capability set (see product documentation). Use it in the workflow above rather than as a standalone report: connect abc classification to daily receiving, shipping, and count routines so data stays current. When Warehouse, Purchase, Sales, POS, or Integration modules are licensed, the same stock ledger feeds abc classification without duplicate entry — that integration is where SMB teams recover the hours lost to spreadsheet reconciliation.
Module licensing is flexible: Inventory is the foundation; enable Warehouse Management, Purchase, Sales, POS, Manufacturing, or Integration Hub connectors when your operating model requires them. Permissions are role-based per tenant — separate who can view, receive, adjust, and approve so controls scale with headcount.
Suggested implementation timeline
- Week 1: Baseline current performance, assign process owner, configure master data fields tied to demand forecast.
- Weeks 2–3: Pilot on one product group or warehouse; post every transaction through Biznsbook documents; no parallel spreadsheet edits.
- Week 4: First review against metrics; tune thresholds, permissions, and training gaps.
- Month 2–3: Expand to all warehouses and categories; add cycle count or replenishment cadence from this guide.
- Ongoing: Monthly ops review using health dashboard and forecast humility checklist.
Metrics to track monthly
- Weeks on hand for top twenty SKUs by revenue
- Count accuracy percentage on A-class items
- Open document aging (GRNs, transfers, adjustments in draft)
- Value at risk from low-stock and overstock KPIs on replenishment views
- Exception rate: lines requiring manual override per hundred transactions
Pick three metrics to start — not all five. Review trend direction, not single points. Improving these metrics usually precedes revenue protection and working-capital releases finance can measure.
Manual / spreadsheet vs integrated ERP
Spreadsheets work for snapshots; they fail as a transaction system. Compare typical manual approaches with how Biznsbook supports demand forecast and related capabilities.
| Capability | Manual / Spreadsheet | Biznsbook |
|---|---|---|
| Baseline usage | ❌ Guess | ✅ History from ledger |
| Weeks on hand | ❌ Manual calc | ✅ Demand forecast view |
| Error measurement | ❌ None | ✅ Forecast accuracy view |
| SKU focus | ❌ Flat | ✅ ABC classification |
| Reorder link | ❌ Disconnected | ✅ Suggestions to replenishment |
| Seasonality | ❌ Forgotten | ✅ Manual overlays documented |
Forecast humility
Publish a forecast error KPI alongside accuracy. Teams that hide error over-fit spreadsheets; teams that measure error improve replenishment settings honestly.
Teams that document this section in their internal inventory SOP onboard new hires faster and pass audits with fewer emergency counts. Revisit quarterly as assortment and warehouse footprint change.
Pair this with the inventory valuation report and stock card when investigating exceptions — numbers in isolation rarely tell the full story without movement history behind them.
Frequently asked questions
How much history do I need?
Twelve weeks minimum for stable items; new SKUs use analogous product proxies until history builds.
What is weeks on hand?
Current on-hand divided by expected weekly usage — shows runway before stockout.
Can forecast automate POs?
Suggestions feed purchase requisitions; human approval remains best practice for SMBs.
Forecast vs budget?
Forecast is operational buying; budget is financial planning — align quarterly but do not confuse them.
How this differs by industry
Retail
Seasonal indexes matter — compare same week last year, not last month.
Wholesale & distribution
Customer contracts may guarantee volume — add to forecast outside system history.
Manufacturing
Forecast components from production plan and BOM explosion when Manufacturing is enabled.