How to Create Financial Dashboards
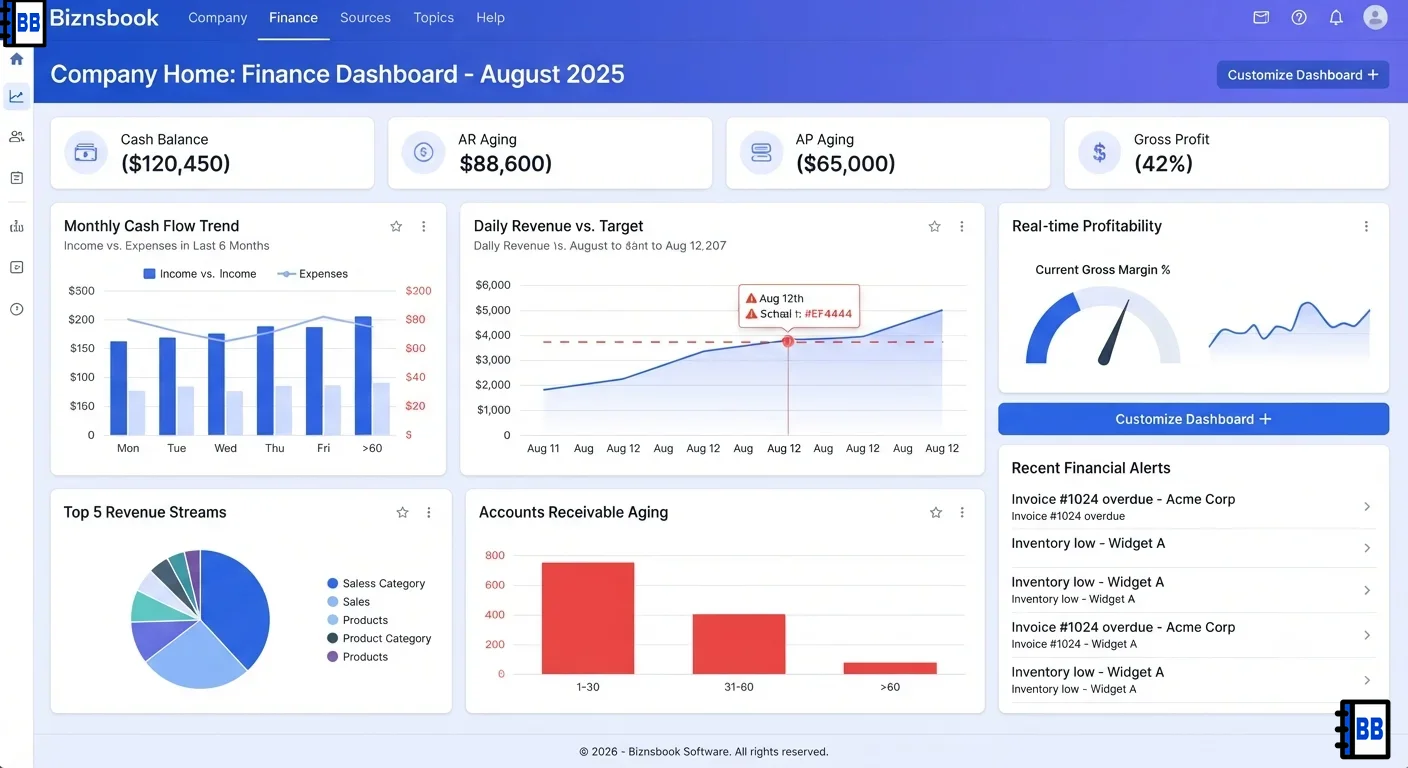
Finance insights stay buried in reports
Busy managers rarely open full statements every day, so critical indicators remain hidden until performance worsens.
Without a curated dashboard, teams chase too many numbers and miss the few that drive action.
Manual KPI boards quickly become stale and lose trust across departments.
Why this happens
- No standardized KPI view.
- Too many disconnected reports.
- Dashboard prerequisites are missing.
- No refresh routine exists.
Biznsbook addresses this through accounting dashboard, company home Finance tab, finance widgets when Accounting is enabled; add Finance Management, Taxation, Expense, Sales, or Purchase modules as your operating model requires.
Finance teams lose days each month reconciling versions that should never have diverged. Naming Biznsbook screens as the system of record — and closing periods when agreed — prevents silent edits that auditors flag immediately.
Step-by-step: Create Financial Dashboards
Designed for owners, bookkeepers, and controllers who need repeatable month-end discipline. Adapt roles to team size — separation of duties matters more than headcount.
- Activate required modules. Confirm POS or Payments is active so accounting dashboard widgets can appear.
- Open company home Finance tab. Navigate to the Finance tab and choose relevant dashboard widgets.
- Select decision KPIs. Prioritize cash, margin, receivables, payables, and trend metrics over vanity numbers.
- Align dashboard to roles. Define which indicators finance, founders, and operations should each monitor.
- Set review cadence. Use a daily glance and a weekly structured dashboard meeting.
- Link to source reports. Drill from widgets into P&L or trial balance when values change materially.
- Refine quarterly. Remove low-value widgets and add new ones as business priorities evolve.
Review results after the first full monthly cycle. Adjust roles, mappings, or approvals where the same exception repeats.
Screen-level flows live in the Help Center. This guide focuses on the business process; help articles cover click-by-click navigation.
Common mistakes to avoid
- Mistake 1: No standardized KPI view. Repeating this each month usually shows up first in trial balance or AR/AP aging.
- Mistake 2: Too many disconnected reports. Repeating this each month usually shows up first in trial balance or AR/AP aging.
- Mistake 3: Dashboard prerequisites are missing. Repeating this each month usually shows up first in trial balance or AR/AP aging.
- Mistake 4: No refresh routine exists. Repeating this each month usually shows up first in trial balance or AR/AP aging.
Track recurring exceptions in month-end notes; each should map to a control above.
Best practices that hold up as you scale
- Activate required modules — Confirm POS or Payments is active so accounting dashboard widgets can appear.
- Open company home Finance tab — Navigate to the Finance tab and choose relevant dashboard widgets.
- Select decision KPIs — Prioritize cash, margin, receivables, payables, and trend metrics over vanity numbers.
- Align dashboard to roles — Define which indicators finance, founders, and operations should each monitor.
- Set review cadence — Use a daily glance and a weekly structured dashboard meeting.
Consistency beats heroics at month-end. A smaller team that closes the same calendar every month outperforms a larger team that posts sporadically.
How Biznsbook supports this workflow
accounting dashboard is documented in Biznsbook Accounting / Finance capabilities. Use it as part of a controlled finance process — posting, review, and period close — not as an isolated export. When Sales, Purchase, Inventory, Taxation, Expense, or Finance Management modules are enabled, related documents can post through the central accounting posting service with double-entry validation.
company home Finance tab is documented in Biznsbook Accounting / Finance capabilities. Use it as part of a controlled finance process — posting, review, and period close — not as an isolated export. When Sales, Purchase, Inventory, Taxation, Expense, or Finance Management modules are enabled, related documents can post through the central accounting posting service with double-entry validation.
finance widgets is documented in Biznsbook Accounting / Finance capabilities. Use it as part of a controlled finance process — posting, review, and period close — not as an isolated export. When Sales, Purchase, Inventory, Taxation, Expense, or Finance Management modules are enabled, related documents can post through the central accounting posting service with double-entry validation.
Permissions are role-based: separate chart maintenance, journal creation, report viewing, period close, and bank reconciliation per tenant policy.
Suggested implementation timeline
- Week 1: Document current process gaps and configure accounting dashboard with finance owner sign-off.
- Weeks 2–3: Pilot on one month or one entity; post all test transactions through Biznsbook; freeze parallel spreadsheet journals.
- Week 4: Run first trial balance or report tie-out; fix mapping and permission issues.
- Month 2–3: Roll out to full team; add approvals and period close cadence from this guide.
- Ongoing: Monthly review using dashboard design rule and leadership dashboard.
Metrics to track monthly
- Days to complete month-end close
- Unreconciled bank lines outstanding
- AR and AP aging buckets over 30/60/90 days
- Trial balance out-of-balance exceptions
- Manual journal count vs automated postings ratio
Start with three metrics; trend direction matters more than a single point-in-time snapshot.
Spreadsheet / manual books vs integrated ERP
Compare typical manual finance work with Biznsbook accounting dashboard and related capabilities.
| Capability | Manual / Spreadsheet | Biznsbook |
|---|---|---|
| KPI access | ❌ Separate reports | ✅ Finance tab widgets |
| Refresh effort | ❌ Manual slides | ✅ System-updated dashboard |
| Decision focus | ❌ Metric overload | ✅ Curated indicator set |
| Root-cause drilldown | ❌ Slow lookup | ✅ Report linkage |
| Cross-team visibility | ❌ Finance silo | ✅ Shared company home view |
| Review discipline | ❌ Irregular | ✅ Defined cadence |
Dashboard design rule
If a metric never triggers a decision, remove it and keep the dashboard focused on action.
Document this in your finance SOP and revisit each quarter as transaction volume or entity structure changes.
Frequently asked questions
Where is this dashboard located?
Use the company home Finance tab where accounting dashboard widgets are displayed.
What enables accounting dashboard visibility?
POS or Payments activation is required for those dashboard components in Biznsbook.
How many KPIs should we track?
Start with a small set of high-impact indicators and expand only when needed.
Can dashboards replace reports?
Dashboards guide attention, but detailed reports are still needed for analysis and controls.
How this differs by industry
Retail
Retail teams should include settlement and margin widgets to connect sales activity with cash outcomes.
Wholesale & distribution
Wholesale organizations should track receivables and payable cycle KPIs on the dashboard for liquidity control.
Manufacturing
Manufacturers should highlight gross margin and cost indicators to catch production-driven profitability shifts.