How to Engineer Restaurant Menu Profitability
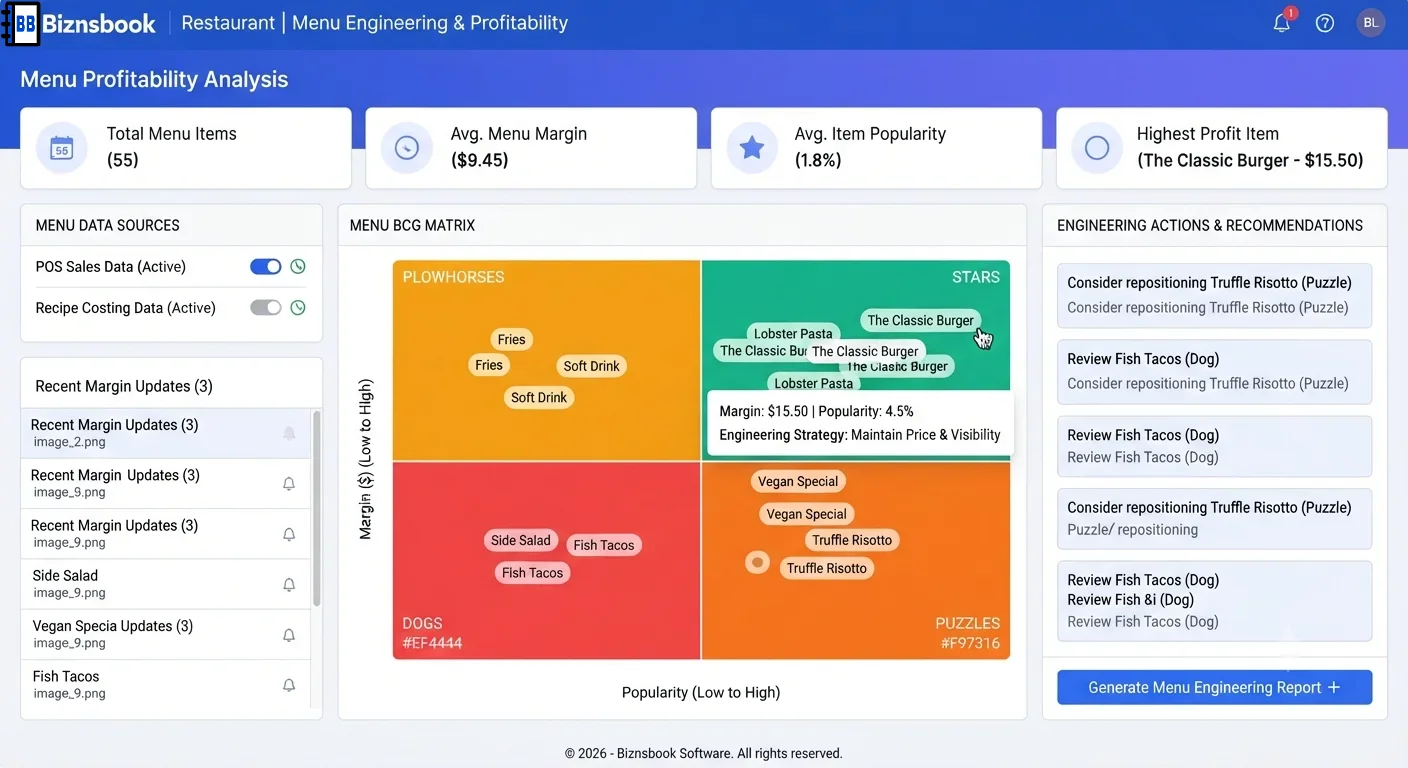
Menus grow by habit, not margin and demand data
Popular plates with weak margin drain profit while high-margin dishes sit unsold. Without classification, marketing pushes the wrong items and chefs prep complexity that does not pay back.
Short review windows mislead decisions. A one-week spike after a promotion can label a dish a Star when normal demand is weak, leading to permanent menu space for a temporary fad.
When food-cost updates are not reflected in recipes, margin rankings use stale economics. Teams repricing or cutting items based on outdated contribution figures make the wrong call.
Why this happens
- Menu decisions rely on server opinion instead of POS portions sold.
- Contribution margin is not tied to active recipe food cost.
- Analysis periods shorter than seven days are treated as definitive.
- Dogs and Plowhorses are not reviewed on a monthly cadence.
Biznsbook addresses this through BCG matrix, contribution margin, POS popularity when Restaurant, Inventory, and POS are licensed — recipes pull live ingredient costs, POS sales drive theoretical COGS and optional auto-depletion, and purchasing workflows stay in the same ERP.
Finance teams lose days each month reconciling versions that should never have diverged. Naming Biznsbook screens as the system of record — and closing periods when agreed — prevents silent edits that auditors flag immediately.
Step-by-step: Engineer Restaurant Menu Profitability
Built for restaurant owners, kitchen managers, and operations leads running recipe-based food costing, POS-linked depletion, and back-of-house controls in Biznsbook.
- Keep active recipes current. Recalculate recipe costs regularly so contribution margin per portion reflects today's ingredient economics.
- Open Menu Engineering report. Select a date range and optional category filter; heed the warning when fewer than seven days are selected.
- Read four headline cards. Review counts and plain-English advice for Stars, Plowhorses, Puzzles, and Dogs, clicking a card to filter the detail table.
- Study the scatter matrix. Use quadrant lines at averages with color-coded points; hover any dish for portions sold and margin per portion.
- Act on each classification. Protect and promote Stars, reprice or reduce cost on Plowhorses, market Puzzles, and consider removing Dogs.
- Drill the sortable detail table. Compare portions, revenue, food-cost %, and total contribution margin, then export to Excel for leadership review.
- Watch dashboard Dogs KPI. Use the monthly Dogs-to-review card on the Restaurant dashboard to queue underperformers for menu committee decisions.
Review results after the first full weekly cycle. Adjust roles, mappings, or approvals where the same exception repeats.
Screen-level flows live in the Help Center. This guide focuses on the business process; help articles cover click-by-click navigation.
Common mistakes to avoid
- Mistake 1: Menu decisions rely on server opinion instead of POS portions sold. Repeating this each month usually shows up first in COGS variance reports or depletion failure logs.
- Mistake 2: Contribution margin is not tied to active recipe food cost. Repeating this each month usually shows up first in COGS variance reports or depletion failure logs.
- Mistake 3: Analysis periods shorter than seven days are treated as definitive. Repeating this each month usually shows up first in COGS variance reports or depletion failure logs.
- Mistake 4: Dogs and Plowhorses are not reviewed on a monthly cadence. Repeating this each month usually shows up first in COGS variance reports or depletion failure logs.
Track recurring exceptions in month-end notes; each should map to a control above.
Best practices that hold up as you scale
- Keep active recipes current — Recalculate recipe costs regularly so contribution margin per portion reflects today's ingredient economics.
- Open Menu Engineering report — Select a date range and optional category filter; heed the warning when fewer than seven days are selected.
- Read four headline cards — Review counts and plain-English advice for Stars, Plowhorses, Puzzles, and Dogs, clicking a card to filter the detail table.
- Study the scatter matrix — Use quadrant lines at averages with color-coded points; hover any dish for portions sold and margin per portion.
- Act on each classification — Protect and promote Stars, reprice or reduce cost on Plowhorses, market Puzzles, and consider removing Dogs.
Teams that activate recipes before enabling auto-deplete, review COGS variance weekly, and log waste at the point of discard avoid the month-end surprises that inflate food cost.
How Biznsbook supports this workflow
BCG matrix is documented in Biznsbook Restaurant capabilities. Use it as part of a controlled finance process — posting, review, and period close — not as an isolated export. When Sales, Purchase, Inventory, Taxation, Expense, or Finance Management modules are enabled, related documents can post through the central accounting posting service with double-entry validation.
contribution margin is documented in Biznsbook Restaurant capabilities. Use it as part of a controlled finance process — posting, review, and period close — not as an isolated export. When Sales, Purchase, Inventory, Taxation, Expense, or Finance Management modules are enabled, related documents can post through the central accounting posting service with double-entry validation.
POS popularity is documented in Biznsbook Restaurant capabilities. Use it as part of a controlled finance process — posting, review, and period close — not as an isolated export. When Sales, Purchase, Inventory, Taxation, Expense, or Finance Management modules are enabled, related documents can post through the central accounting posting service with double-entry validation.
Restaurant permissions separate recipe management, waste logging, par levels, floor plans, KDS, reservations, and settings. Inventory and POS are prerequisites for depletion and costing.
Suggested implementation timeline
- Week 1: Document current process gaps and configure BCG matrix with finance owner sign-off.
- Weeks 2–3: Pilot on one month or one entity; post all test transactions through Biznsbook; freeze parallel spreadsheet journals.
- Week 4: Run first trial balance or report tie-out; fix mapping and permission issues.
- Month 2–3: Roll out to full team; add approvals and period close cadence from this guide.
- Ongoing: Monthly review using menu committee agenda and leadership dashboard.
Metrics to track monthly
- Food cost % vs target (theoretical ÷ POS sales)
- COGS variance % by ingredient (red / amber / green)
- Failed or stuck sale depletions
- Today waste cost vs daily threshold
- Par level shortages and unread supplier price alerts
Start with three metrics; trend direction matters more than a single point-in-time snapshot.
Spreadsheet / manual books vs integrated ERP
Compare typical manual finance work with Biznsbook BCG matrix and related capabilities.
| Capability | Manual / Spreadsheet | Biznsbook |
|---|---|---|
| Popularity input | ❌ Staff anecdotes | ✅ POS portions sold in range |
| Margin input | ❌ Guess or old cost | ✅ Sale price minus recipe food cost |
| Classification | ❌ Informal favorites | ✅ Star / Plowhorse / Puzzle / Dog |
| Visualization | ❌ Static menu list | ✅ Interactive scatter matrix |
| Action guidance | ❌ None | ✅ Per-quadrant recommendations |
| Safety | ❌ Risky auto changes | ✅ Read-only analytics only |
Frequently asked questions
Does menu engineering change my prices?
No. It is read-only analytics; you decide pricing, marketing, and removal actions outside the report.
How is contribution margin calculated?
It uses sale price minus theoretical food cost from active recipes over your selected date range.
Why warn on short date ranges?
Fewer than seven days can mislead because promotions or weather skew popularity and margin rankings.
How often is data refreshed?
Results cache per period and are flagged stale nightly as new sales and cost data land, recalculating when needed.
How this differs by industry
Retail
Fast-casual brands use Stars to feature limited-time combo boards while repricing Plowhorses that sell volume but erode lunch margin.
Wholesale & distribution
Commissary menus sold B2B can filter by category to see which bulk items are Puzzles needing sales focus versus Dogs to retire.
Manufacturing
Franchise menu committees export the matrix quarterly so corporate and operators agree which items are mandatory versus local optional.