How to Track Restaurant COGS Variance
High food cost feels vague without ingredient-level variance
Owners often see food-cost percentage rise on the P&L but cannot explain which ingredients drove the change. Without theoretical versus actual comparison, teams blame portioning, waste, or theft without evidence.
When variance is reviewed only at month end, corrective action arrives too late. Over-portioning, mis-scaled recipes, and unlogged waste compound across weeks before anyone investigates.
Disconnected reporting also hides warehouse-specific issues. A single location or store room can skew totals while the overall average looks acceptable on summary reports.
Why this happens
- Theoretical usage is not calculated from POS sales and active recipes.
- Actual stock movement is not compared to nightly snapshots by ingredient.
- Variance thresholds are not reviewed on a fixed weekly rhythm.
- Warehouse filters are unused, so localized leaks stay hidden.
Biznsbook addresses this through COGS variance report, theoretical snapshots, COGS dashboard when Restaurant, Inventory, and POS are licensed — recipes pull live ingredient costs, POS sales drive theoretical COGS and optional auto-depletion, and purchasing workflows stay in the same ERP.
Finance teams lose days each month reconciling versions that should never have diverged. Naming Biznsbook screens as the system of record — and closing periods when agreed — prevents silent edits that auditors flag immediately.
Step-by-step: Track Restaurant COGS Variance
Built for restaurant owners, kitchen managers, and operations leads running recipe-based food costing, POS-linked depletion, and back-of-house controls in Biznsbook.
- Confirm active recipes and POS sales. Ensure menu items sold at the till link to Active recipes so theoretical snapshots reflect real production assumptions.
- Set company time zone in settings. Configure Restaurant time zone so nightly theoretical jobs align with your operating day boundaries.
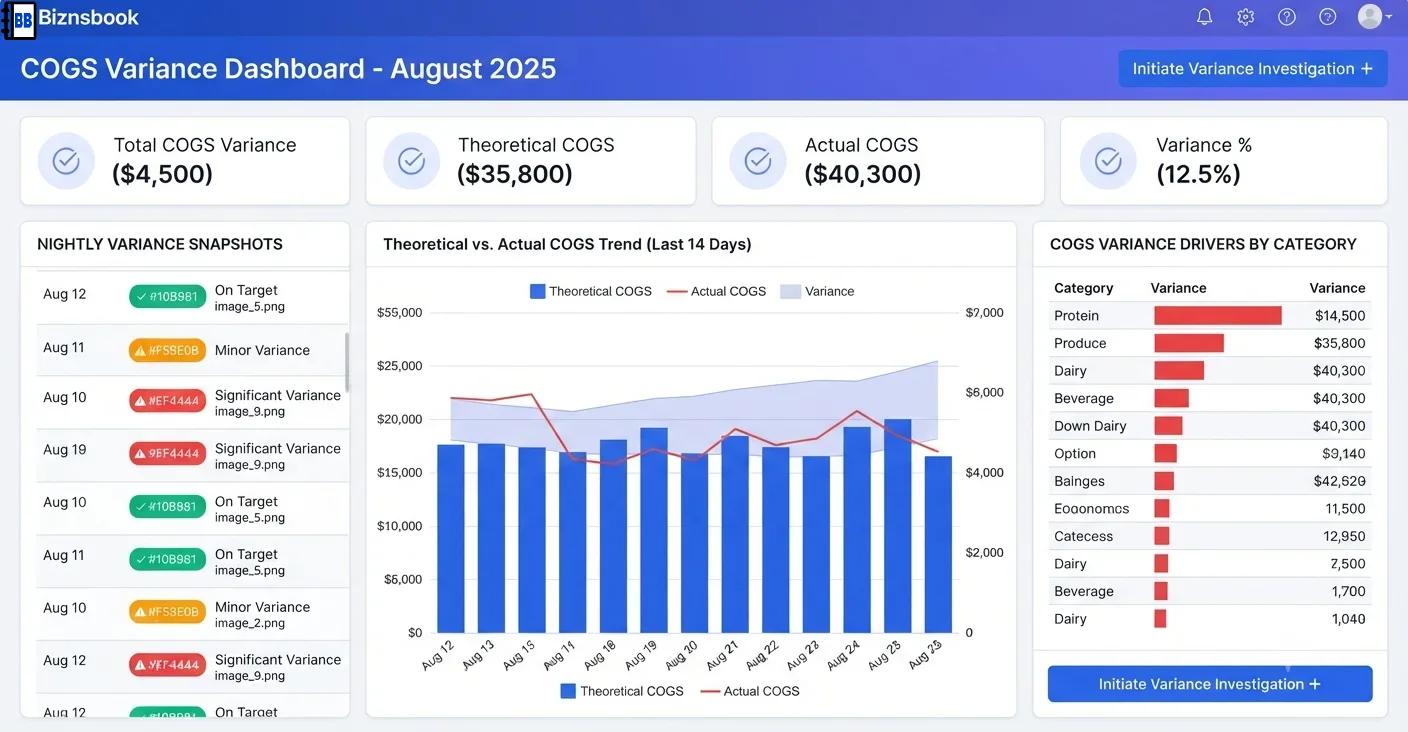
- Review COGS Dashboard daily. Check total theoretical vs actual cost, overall variance %, the trend chart, and top five problem ingredients for fast prioritization.
- Open COGS Variance report. Filter by date range and optional warehouse, then sort ingredients by largest discrepancy with color-coded flags.
- Investigate red and amber items first. Focus on variance above 10%, treating over 20% as urgent — typical signals include over-portioning, waste, theft, or mis-priced recipes.
- Recalculate snapshots when needed. Use on-demand Recalculate for any date range up to about three months to back-fill or refresh data after recipe corrections.
- Export and assign corrective owners. Download the variance grid to Excel, assign kitchen and purchasing follow-ups, then verify improvement on the next weekly dashboard review.
Review results after the first full weekly cycle. Adjust roles, mappings, or approvals where the same exception repeats.
Screen-level flows live in the Help Center. This guide focuses on the business process; help articles cover click-by-click navigation.
Common mistakes to avoid
- Mistake 1: Theoretical usage is not calculated from POS sales and active recipes. Repeating this each month usually shows up first in COGS variance reports or depletion failure logs.
- Mistake 2: Actual stock movement is not compared to nightly snapshots by ingredient. Repeating this each month usually shows up first in COGS variance reports or depletion failure logs.
- Mistake 3: Variance thresholds are not reviewed on a fixed weekly rhythm. Repeating this each month usually shows up first in COGS variance reports or depletion failure logs.
- Mistake 4: Warehouse filters are unused, so localized leaks stay hidden. Repeating this each month usually shows up first in COGS variance reports or depletion failure logs.
Track recurring exceptions in month-end notes; each should map to a control above.
Best practices that hold up as you scale
- Confirm active recipes and POS sales — Ensure menu items sold at the till link to Active recipes so theoretical snapshots reflect real production assumptions.
- Set company time zone in settings — Configure Restaurant time zone so nightly theoretical jobs align with your operating day boundaries.
- Review COGS Dashboard daily — Check total theoretical vs actual cost, overall variance %, the trend chart, and top five problem ingredients for fast prioritization.
- Open COGS Variance report — Filter by date range and optional warehouse, then sort ingredients by largest discrepancy with color-coded flags.
- Investigate red and amber items first — Focus on variance above 10%, treating over 20% as urgent — typical signals include over-portioning, waste, theft, or mis-priced recipes.
Teams that activate recipes before enabling auto-deplete, review COGS variance weekly, and log waste at the point of discard avoid the month-end surprises that inflate food cost.
How Biznsbook supports this workflow
COGS variance report is documented in Biznsbook Restaurant capabilities. Use it as part of a controlled finance process — posting, review, and period close — not as an isolated export. When Sales, Purchase, Inventory, Taxation, Expense, or Finance Management modules are enabled, related documents can post through the central accounting posting service with double-entry validation.
theoretical snapshots is documented in Biznsbook Restaurant capabilities. Use it as part of a controlled finance process — posting, review, and period close — not as an isolated export. When Sales, Purchase, Inventory, Taxation, Expense, or Finance Management modules are enabled, related documents can post through the central accounting posting service with double-entry validation.
COGS dashboard is documented in Biznsbook Restaurant capabilities. Use it as part of a controlled finance process — posting, review, and period close — not as an isolated export. When Sales, Purchase, Inventory, Taxation, Expense, or Finance Management modules are enabled, related documents can post through the central accounting posting service with double-entry validation.
Restaurant permissions separate recipe management, waste logging, par levels, floor plans, KDS, reservations, and settings. Inventory and POS are prerequisites for depletion and costing.
Suggested implementation timeline
- Week 1: Document current process gaps and configure COGS variance report with finance owner sign-off.
- Weeks 2–3: Pilot on one month or one entity; post all test transactions through Biznsbook; freeze parallel spreadsheet journals.
- Week 4: Run first trial balance or report tie-out; fix mapping and permission issues.
- Month 2–3: Roll out to full team; add approvals and period close cadence from this guide.
- Ongoing: Monthly review using variance triage order and leadership dashboard.
Metrics to track monthly
- Food cost % vs target (theoretical ÷ POS sales)
- COGS variance % by ingredient (red / amber / green)
- Failed or stuck sale depletions
- Today waste cost vs daily threshold
- Par level shortages and unread supplier price alerts
Start with three metrics; trend direction matters more than a single point-in-time snapshot.
Spreadsheet / manual books vs integrated ERP
Compare typical manual finance work with Biznsbook COGS variance report and related capabilities.
| Capability | Manual / Spreadsheet | Biznsbook |
|---|---|---|
| Theoretical baseline | ❌ Estimated usage | ✅ Nightly POS-and-recipe snapshots |
| Actual comparison | ❌ Month-end stock guess | ✅ Inventory movement by ingredient |
| Prioritization | ❌ Gut feel | ✅ Ranked variance with color flags |
| Trend visibility | ❌ Single period total | ✅ Theoretical-vs-actual daily chart |
| Scope control | ❌ Company-wide only | ✅ Date range and warehouse filters |
| Back-fill | ❌ Manual journals | ✅ On-demand snapshot recalculate |
Variance triage order
Start with the top three red-flag ingredients, verify recipe quantities and waste %, then check logged waste and depletion health for the same period. This sequence resolves most unexplained variance without broad audits.
Document this in your finance SOP and revisit each quarter as transaction volume or entity structure changes.
Frequently asked questions
When are theoretical snapshots created?
A daily background job records the previous day's theoretical ingredient cost from POS sales for each active recipe, per company time zone.
What do the color flags mean?
Variance over 20% shows red, 10–20% amber, and under 10% green so the worst offenders stand out immediately.
Can I refresh old dates?
Yes. Recalculate on demand for a selected date range to back-fill or refresh snapshots after recipe or data corrections.
Does waste logging replace variance tracking?
No. Waste logging explains part of variance; the COGS Variance report still shows total theoretical vs actual gaps across all ingredients.
How this differs by industry
Retail
Fast-casual chains can compare variance by warehouse when each store holds its own stock, isolating over-portioning at high-volume locations.
Wholesale & distribution
Commissary operations feeding multiple sites can use warehouse filters to see whether production or receiving variance is driving ingredient gaps.
Manufacturing
Franchise operators can rank variance ingredients weekly across the estate and direct field coaches to locations with repeated red-flag items.