How to Create Sales Forecasts
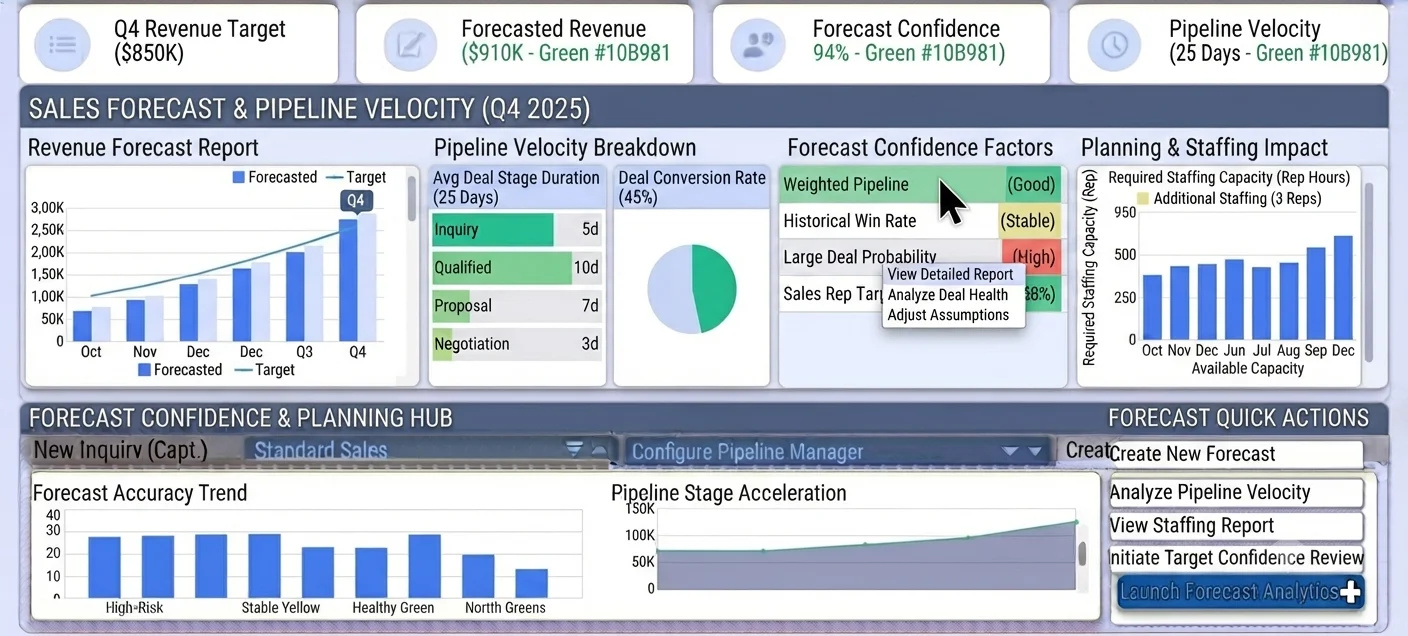
Forecasts fail when assumptions are invisible
Forecast meetings often debate confidence without shared evidence. Reps and managers use different assumptions about deal probability, timeline, and close criteria, leading to inconsistent numbers.
Even accurate stage snapshots can mislead if velocity slows. Deals may appear healthy by value but still miss period targets due to longer cycle time.
Poor forecasts affect more than sales leadership. Hiring, inventory, and cash planning all depend on credible revenue outlooks.
Why this happens
- Forecasts rely on subjective confidence instead of conversion data.
- Pipeline velocity is not tracked alongside deal value.
- Stale opportunities inflate expected period revenue.
- Performance and forecast processes are disconnected.
Biznsbook addresses this through Revenue forecast report, pipeline velocity when the CRM module is enabled. Add Business Automation and Communication Center for drip nurture on crm.lead.created; add Sales and Accounting for order-to-cash when deals close.
Finance teams lose days each month reconciling versions that should never have diverged. Naming Biznsbook screens as the system of record — and closing periods when agreed — prevents silent edits that auditors flag immediately.
Step-by-step: Create Sales Forecasts
Built for sales reps, managers, and RevOps leads who need a repeatable funnel — not heroic inbox chasing. Adapt roles to your team size.
- Set forecast methodology. Decide whether forecasting uses stage-weighted, commit, or hybrid logic by segment.
- Use Revenue Forecast report. Review expected revenue by owner, stage, and period using CRM forecasting views.
- Measure pipeline velocity. Track average cycle speed and detect slowdowns that threaten period closure.
- Validate with conversion trends. Compare current stage conversion rates with historical baselines.
- Discount stale opportunities. Apply conservative assumptions to aging deals with weak health signals.
- Link to performance cadence. Use rep-level attainment and activity trends to support forecast confidence adjustments.
- Run weekly re-forecast rhythm. Update assumptions every week so leadership planning stays current.
Review results after the first full weekly cycle. Adjust roles, mappings, or approvals where the same exception repeats.
Screen-level flows live in the Help Center (tax setup, expense claims, sale invoices). This guide focuses on finance process; help articles cover navigation.
Common mistakes to avoid
- Mistake 1: Forecasts rely on subjective confidence instead of conversion data. Repeating this each month usually shows up first in pipeline velocity or lead aging reports.
- Mistake 2: Pipeline velocity is not tracked alongside deal value. Repeating this each month usually shows up first in pipeline velocity or lead aging reports.
- Mistake 3: Stale opportunities inflate expected period revenue. Repeating this each month usually shows up first in pipeline velocity or lead aging reports.
- Mistake 4: Performance and forecast processes are disconnected. Repeating this each month usually shows up first in pipeline velocity or lead aging reports.
Track recurring exceptions in month-end notes; each should map to a control above.
Best practices that hold up as you scale
- Set forecast methodology — Decide whether forecasting uses stage-weighted, commit, or hybrid logic by segment.
- Use Revenue Forecast report — Review expected revenue by owner, stage, and period using CRM forecasting views.
- Measure pipeline velocity — Track average cycle speed and detect slowdowns that threaten period closure.
- Validate with conversion trends — Compare current stage conversion rates with historical baselines.
- Discount stale opportunities — Apply conservative assumptions to aging deals with weak health signals.
Teams that review pipeline and lead aging weekly close more consistently than teams that only report at month-end.
How Biznsbook supports this workflow
Revenue forecast report is documented in Biznsbook CRM / Sales capabilities. Use it as part of a controlled finance process — posting, review, and period close — not as an isolated export. When Sales, Purchase, Inventory, Taxation, Expense, or Finance Management modules are enabled, related documents can post through the central accounting posting service with double-entry validation.
pipeline velocity is documented in Biznsbook CRM / Sales capabilities. Use it as part of a controlled finance process — posting, review, and period close — not as an isolated export. When Sales, Purchase, Inventory, Taxation, Expense, or Finance Management modules are enabled, related documents can post through the central accounting posting service with double-entry validation.
CRM roles (rep, manager, admin) govern export, settings, and reassignment. Workflow automations live in Business Automation — not buried in personal inboxes.
Suggested implementation timeline
- Week 1: Document current process gaps and configure Revenue forecast report with finance owner sign-off.
- Weeks 2–3: Pilot on one month or one entity; post all test transactions through Biznsbook; freeze parallel spreadsheet journals.
- Week 4: Run first trial balance or report tie-out; fix mapping and permission issues.
- Month 2–3: Roll out to full team; add approvals and period close cadence from this guide.
- Ongoing: Monthly review using forecast confidence bands and leadership dashboard.
Metrics to track monthly
- Lead response time (minutes from create to first activity)
- Lead-to-opportunity conversion rate by source
- Pipeline velocity and stage aging days
- Win rate and average deal size
- Forecast vs actual revenue (closed-won)
Start with three metrics; trend direction matters more than a single point-in-time snapshot.
Spreadsheet / manual books vs integrated ERP
Compare typical manual finance work with Biznsbook Revenue forecast report and related capabilities.
| Capability | Manual / Spreadsheet | Biznsbook |
|---|---|---|
| Forecast logic | ❌ Rep optimism | ✅ Defined weighted methodology |
| Primary report | ❌ Manual spreadsheets | ✅ Revenue Forecast report |
| Timing quality | ❌ Ignored | ✅ Pipeline velocity tracking |
| Data freshness | ❌ Month-end updates | ✅ Weekly re-forecasting |
| Risk treatment | ❌ All deals equal | ✅ Stale-deal discounting |
| Planning value | ❌ Low confidence | ✅ Evidence-based decisions |
Forecast confidence bands
Use best-case, expected, and conservative bands based on conversion and velocity history. Confidence ranges improve planning under uncertainty.
Document this in your finance SOP and revisit each quarter as transaction volume or entity structure changes.
Frequently asked questions
What makes a forecast trustworthy?
Consistency of method, fresh opportunity data, and explicit assumptions tied to conversion and cycle trends. Without those, forecasts become opinion-heavy.
How does pipeline velocity affect forecast accuracy?
Velocity reflects how quickly opportunities progress. Slower velocity often means revenue shifts out of period, even when total pipeline value appears strong.
How often should forecasts be updated?
Weekly updates are practical for most SMB teams and provide enough cadence for corrective action and planning.
Should forecast and target reviews be separate?
They can be separate meetings but should use connected data, since performance trends directly influence forecast reliability.
How this differs by industry
Retail
Retail B2B teams can forecast by account tier and seasonality while validating pipeline velocity against campaign and procurement cycles.
Wholesale & distribution
Wholesale businesses should combine distributor pipeline value with velocity and conversion trends to improve replenishment and staffing plans.
Manufacturing
Manufacturers can improve planning by forecasting project-based deals with realistic technical review timelines and stage probabilities.