How to Track Sales Team Performance
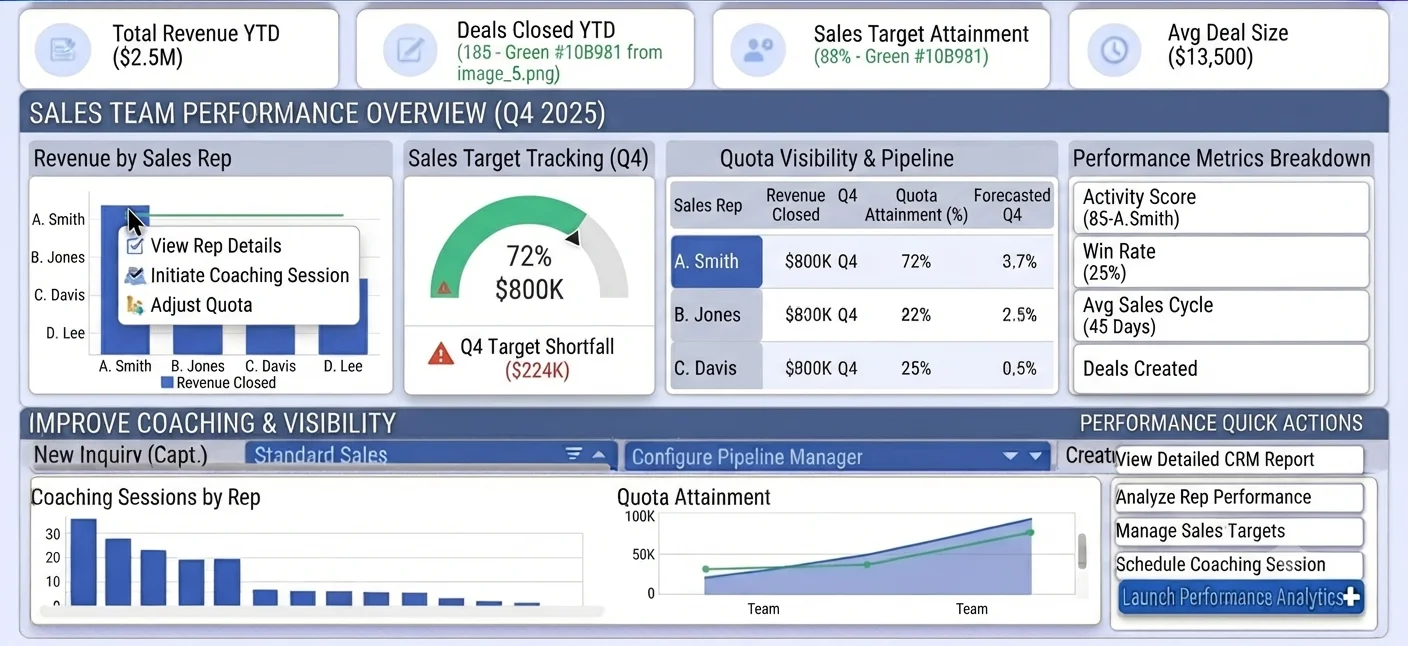
Why quota tracking alone is not enough
Many teams only review closed revenue at month end. By then, performance gaps are visible but no longer fixable. Effective management requires earlier indicators that reveal whether pipeline behavior supports target attainment.
When reports are exported and rebuilt manually, definitions drift across managers. One team counts only won deals, another includes late-stage pipeline, and comparisons lose meaning.
Performance conversations also become personal instead of process-driven. Reps need objective metrics tied to stages and activities to improve consistently.
Why this happens
- Performance data is reviewed too late in the sales cycle.
- Managers rely on separate spreadsheets with inconsistent definitions.
- Targets exist but are not tied to pipeline and activity indicators.
- Dashboard usage is inconsistent across team leads.
Biznsbook addresses this through CRM reports, sales targets, performance dashboard when the CRM module is enabled. Add Business Automation and Communication Center for drip nurture on crm.lead.created; add Sales and Accounting for order-to-cash when deals close.
Finance teams lose days each month reconciling versions that should never have diverged. Naming Biznsbook screens as the system of record — and closing periods when agreed — prevents silent edits that auditors flag immediately.
Step-by-step: Track Sales Team Performance
Built for sales reps, managers, and RevOps leads who need a repeatable funnel — not heroic inbox chasing. Adapt roles to your team size.
- Set role-based targets. Define monthly and quarterly sales targets per rep, territory, or segment.
- Use /CRM/Performance regularly. Review the performance dashboard at `/CRM/Performance`, not only top-level menu snapshots.
- Pair outcomes with activities. Track wins, conversion, and average cycle time alongside calls, meetings, and follow-ups.
- Standardize report definitions. Align KPI formulas across managers before publishing coaching scorecards.
- Run weekly coaching reviews. Discuss rep-level trends with evidence from CRM reports and activity logs.
- Flag target risk early. Create alerts for reps falling behind pace so intervention happens before month end.
- Link plans to forecast quality. Validate whether rep performance patterns support current forecast assumptions.
Review results after the first full weekly cycle. Adjust roles, mappings, or approvals where the same exception repeats.
Screen-level flows live in the Help Center (tax setup, expense claims, sale invoices). This guide focuses on finance process; help articles cover navigation.
Common mistakes to avoid
- Mistake 1: Performance data is reviewed too late in the sales cycle. Repeating this each month usually shows up first in pipeline velocity or lead aging reports.
- Mistake 2: Managers rely on separate spreadsheets with inconsistent definitions. Repeating this each month usually shows up first in pipeline velocity or lead aging reports.
- Mistake 3: Targets exist but are not tied to pipeline and activity indicators. Repeating this each month usually shows up first in pipeline velocity or lead aging reports.
- Mistake 4: Dashboard usage is inconsistent across team leads. Repeating this each month usually shows up first in pipeline velocity or lead aging reports.
Track recurring exceptions in month-end notes; each should map to a control above.
Best practices that hold up as you scale
- Set role-based targets — Define monthly and quarterly sales targets per rep, territory, or segment.
- Use /CRM/Performance regularly — Review the performance dashboard at `/CRM/Performance`, not only top-level menu snapshots.
- Pair outcomes with activities — Track wins, conversion, and average cycle time alongside calls, meetings, and follow-ups.
- Standardize report definitions — Align KPI formulas across managers before publishing coaching scorecards.
- Run weekly coaching reviews — Discuss rep-level trends with evidence from CRM reports and activity logs.
Teams that review pipeline and lead aging weekly close more consistently than teams that only report at month-end.
How Biznsbook supports this workflow
CRM reports is documented in Biznsbook CRM / Sales capabilities. Use it as part of a controlled finance process — posting, review, and period close — not as an isolated export. When Sales, Purchase, Inventory, Taxation, Expense, or Finance Management modules are enabled, related documents can post through the central accounting posting service with double-entry validation.
sales targets is documented in Biznsbook CRM / Sales capabilities. Use it as part of a controlled finance process — posting, review, and period close — not as an isolated export. When Sales, Purchase, Inventory, Taxation, Expense, or Finance Management modules are enabled, related documents can post through the central accounting posting service with double-entry validation.
performance dashboard is documented in Biznsbook CRM / Sales capabilities. Use it as part of a controlled finance process — posting, review, and period close — not as an isolated export. When Sales, Purchase, Inventory, Taxation, Expense, or Finance Management modules are enabled, related documents can post through the central accounting posting service with double-entry validation.
CRM roles (rep, manager, admin) govern export, settings, and reassignment. Workflow automations live in Business Automation — not buried in personal inboxes.
Suggested implementation timeline
- Week 1: Document current process gaps and configure CRM reports with finance owner sign-off.
- Weeks 2–3: Pilot on one month or one entity; post all test transactions through Biznsbook; freeze parallel spreadsheet journals.
- Week 4: Run first trial balance or report tie-out; fix mapping and permission issues.
- Month 2–3: Roll out to full team; add approvals and period close cadence from this guide.
- Ongoing: Monthly review using performance review template and leadership dashboard.
Metrics to track monthly
- Lead response time (minutes from create to first activity)
- Lead-to-opportunity conversion rate by source
- Pipeline velocity and stage aging days
- Win rate and average deal size
- Forecast vs actual revenue (closed-won)
Start with three metrics; trend direction matters more than a single point-in-time snapshot.
Spreadsheet / manual books vs integrated ERP
Compare typical manual finance work with Biznsbook CRM reports and related capabilities.
| Capability | Manual / Spreadsheet | Biznsbook |
|---|---|---|
| Visibility timing | ❌ Month-end only | ✅ Weekly dashboard cadence |
| Dashboard source | ❌ Ad hoc exports | ✅ /CRM/Performance view |
| KPI design | ❌ Revenue only | ✅ Outcomes plus activities |
| Coaching | ❌ Anecdotal feedback | ✅ Metric-driven conversations |
| Target tracking | ❌ Static quota sheet | ✅ Live pace versus goals |
| Forecast linkage | ❌ Separate process | ✅ Performance-informed forecasting |
Performance review template
Use one-page weekly reviews per rep: target pace, top opportunities, stalled deals, key activities, and coaching actions. Consistent format improves accountability.
Document this in your finance SOP and revisit each quarter as transaction volume or entity structure changes.
Frequently asked questions
Where is the performance dashboard in Biznsbook?
Use the dedicated route at `/CRM/Performance`. Teams often miss it because it is not treated as a simple main-menu snapshot.
Which metric should managers prioritize first?
Start with target attainment pace and stage conversion rates. Together they reveal both results and underlying execution quality.
How often should rep performance be reviewed?
Weekly check-ins work best for active pipelines. Monthly-only reviews are usually too slow to correct performance drift.
Can activity metrics be misleading?
Yes, if isolated. Always pair activity volume with conversion and cycle quality to avoid rewarding motion without progress.
How this differs by industry
Retail
Retail B2B managers can track branch account growth and repeat order wins while coaching reps on activity quality, not only call counts.
Wholesale & distribution
Wholesale teams benefit from territory target pacing and account-level conversion insights to allocate effort where margin and volume potential are highest.
Manufacturing
Manufacturing sellers need KPI views that combine project pipeline milestones with rep execution cadence and technical follow-up completion.